Meistä
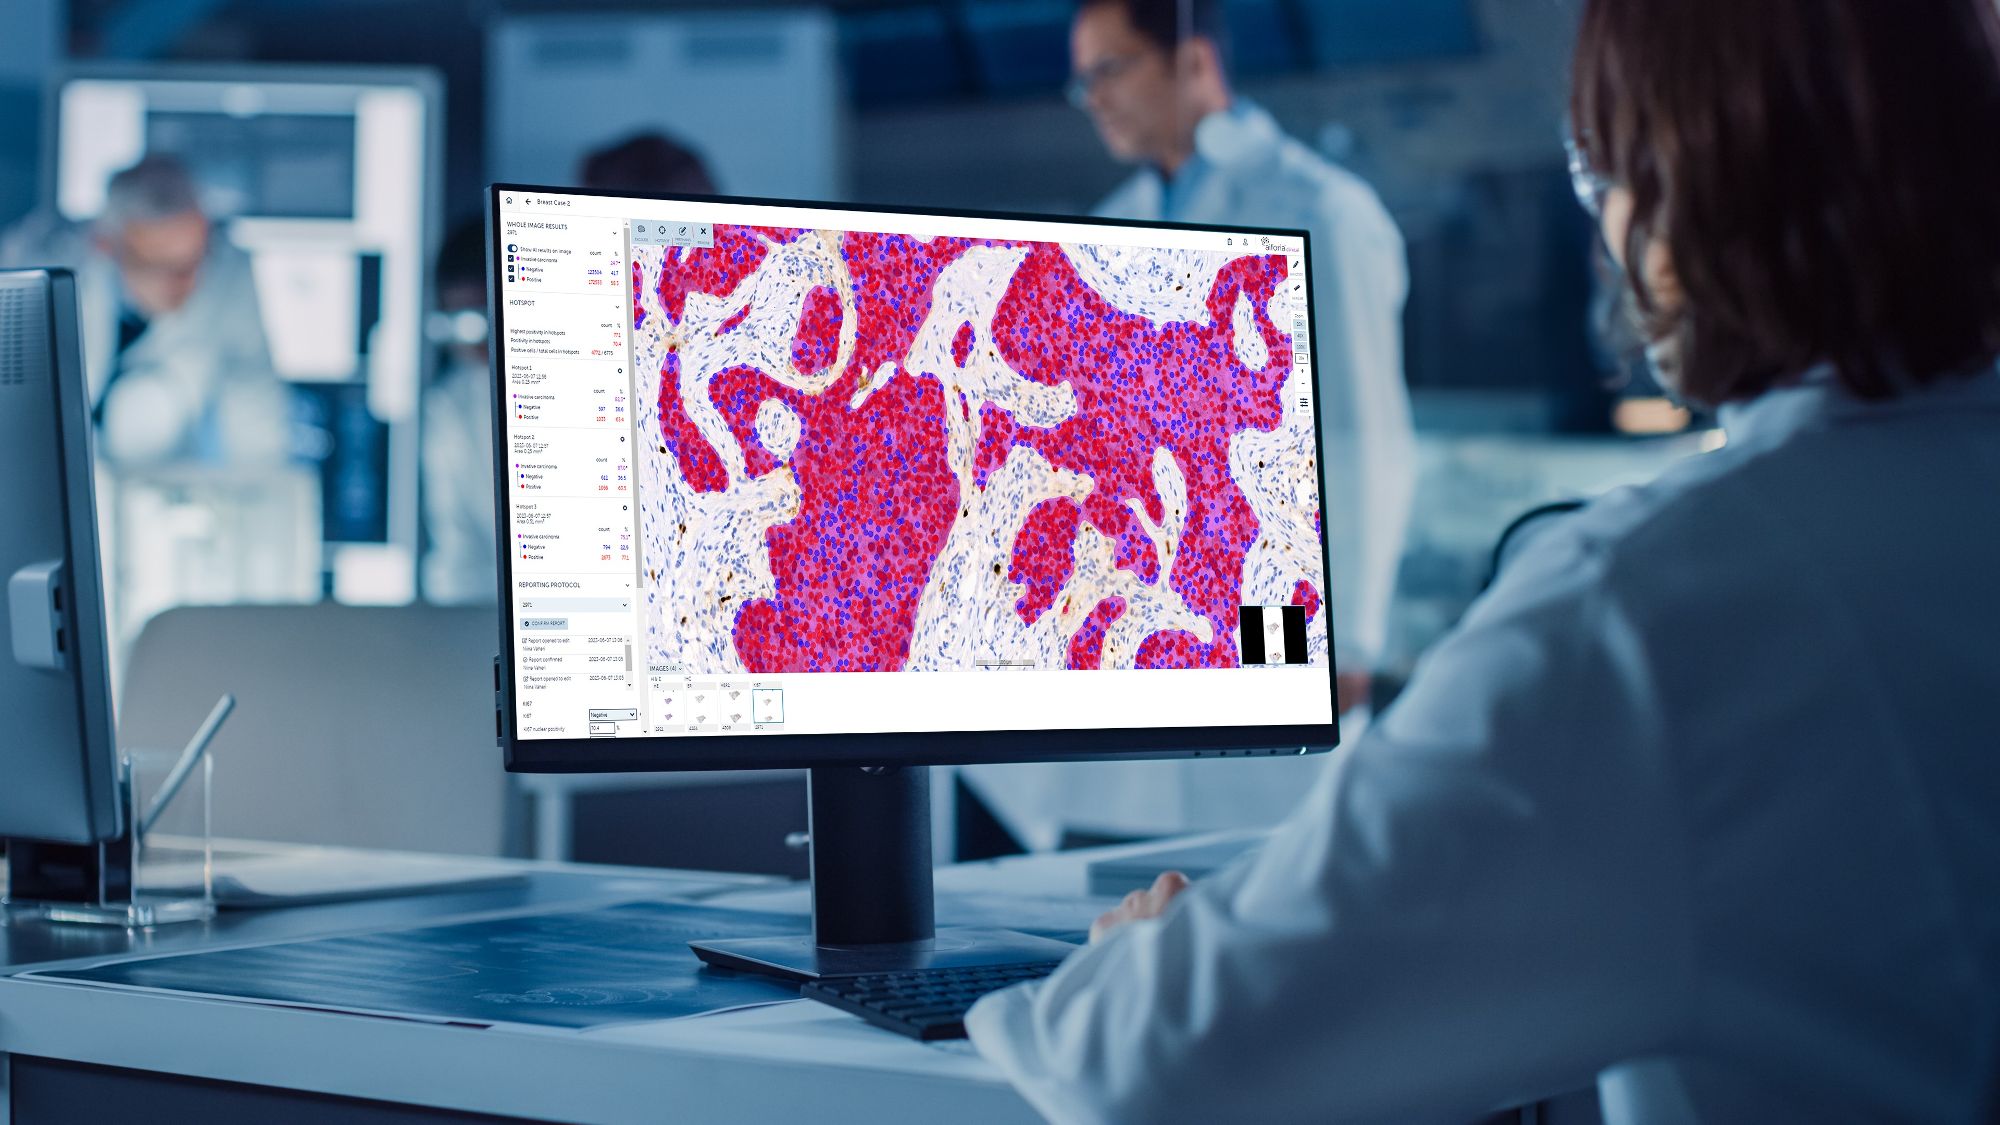
Aiforia on lääketieteen ohjelmistoyritys, jonka tavoitteena on mullistaa patologian kuvien analysointi tekoälyn avulla.
Aiforia tarjoaa patologeille ja tutkijoille kliinisissä, prekliinisissä ja akateemisissa laboratorioissa tehokkaan syväoppivan tekoälyohjelmiston. Aiforian pilvipohjaisilla ratkaisuilla pyritään parantamaan lääketieteellisten kuvien analysoinnin tehokkuutta, tarkkuutta ja toistettavuutta erityisesti patologiassa.
Avainluvut
Miksi Aiforia?
Markkina
Syövän jatkuvasti kasvava esiintyvyys kuormittaa patologeja, jotka tarvitsevat parempia tapoja analysoida näytteitä vastatakseen kysyntään. Investoinnit digitaaliseen patologiaan lisääntyivät Covid-19-pandemian aikana, kun etätyöskentely oli tarpeellista. Tämä herätti myös merkittävää kiinnostusta näytteiden analysoinnin digitaalista automatisointia kohtaan.
Vahvuudet
Aiforia on noin vuosikymmenen ajan kehittänyt kuva-analyysiohjelmistoja lääketieteelliseen tutkimuskäyttöön ja sen ratkaisulla on maailmanlaajuinen käyttäjäkunta patologeja. Olemassa olevan tunnistuksen ja uusien kuva-analyysimallien helpon luomisen ansiosta Aiforia on otettu nopeasti käyttöön kliinisessä patologiassa (esim. Mayo Clinic, NHS, Veneto).
Strategia
Aiforia priorisoi kliinistä myyntiä suurimmille syöpädiagnostiikan tarjoajille ja hyödyntää asemaansa patologian tutkimusyhteisössä voittaakseen uusia kliinisiä asiakkaita. Yhtiö jatkaa myös nykyisten ja uusien suurempien tutkimusasiakkaiden palvelemista tukeakseen tuotekehitystään ja avatakseen ovia uusiin kliinisiin asiakkuuksiin.